Ballpark Dimensions and Their Influence on Home Run Prop Markets Across MLB Divisions
Written by Katja Baumann · Jul 3, 2026
Ballpark Dimensions and Their Influence on Home Run Prop Markets Across MLB Divisions
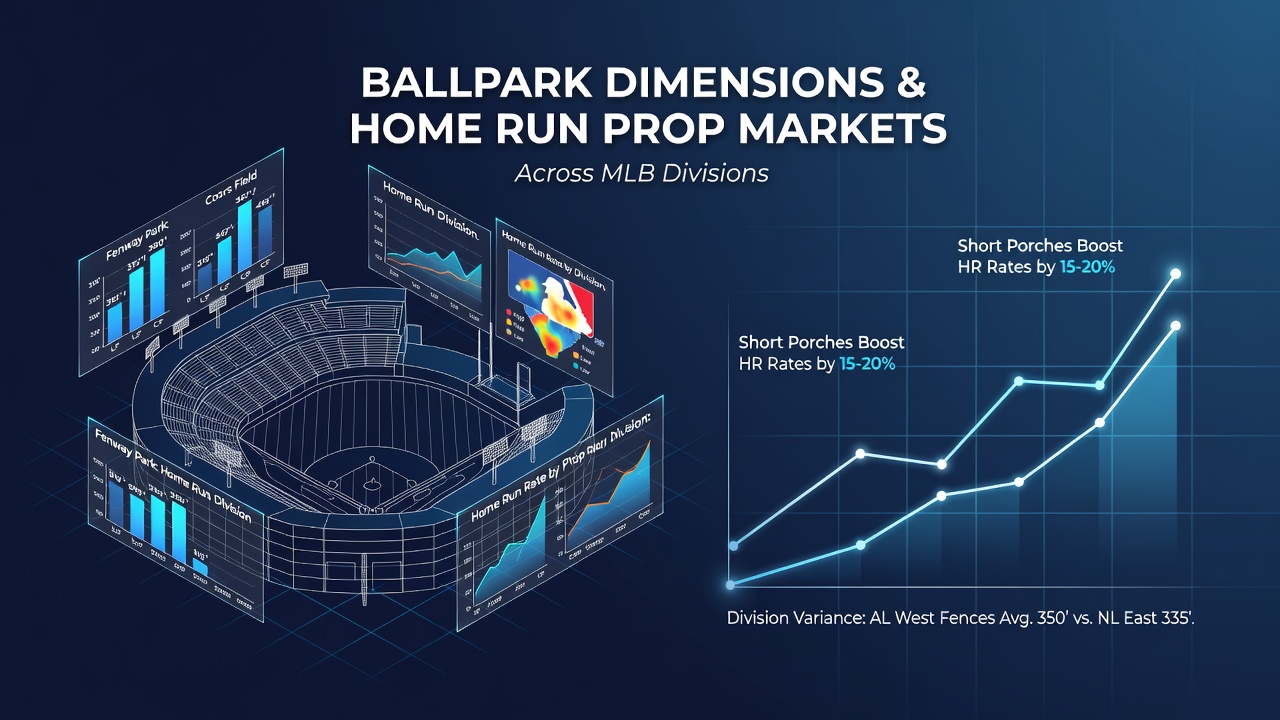
Ballpark dimensions shape home run production in Major League Baseball because outfield distances, wall heights and altitude combine to create distinct environments that alter batted ball outcomes and researchers track these variables through park factor calculations that quantify offensive advantages or disadvantages at each venue. Data from the 2026 season shows continued variation across divisions with the American League East featuring compact parks like Fenway Park that compress left field distances while the National League West includes Coors Field where thin air at high elevation extends fly ball carry substantially.
Teams in hitter friendly parks generate elevated home run rates that betting markets incorporate when setting player prop lines and this adjustment process reflects aggregated historical performance rather than isolated game results. Observers note that left handed power hitters benefit from shorter right field porches in several stadiums whereas right handed batters find opportunities in venues with reduced left field dimensions and these patterns hold across multiple seasons according to league wide tracking systems.
American League Divisions and Dimension Effects
The American League East presents a mix of intimate and expansive layouts that influence prop market volatility with Fenway Park maintaining its signature short left field wall that converts certain fly balls into home runs while Yankee Stadium offers balanced dimensions that produce consistent but not extreme home run totals. Data indicates that players facing Boston Red Sox pitching staff encounter adjusted lines reflecting the park's history of boosting left field power whereas Toronto's Rogers Centre uses a retractable roof that creates variable conditions depending on weather and configuration.
In the American League Central dimensions range from the spacious outfields at Kauffman Stadium in Kansas City which suppress home runs to the more compact Guaranteed Rate Field in Chicago that allows deeper fly balls to clear fences more readily and prop markets respond by shifting over under thresholds accordingly. Analysts compile these differences into seasonal park factors that show Cleveland's Progressive Field maintaining neutral tendencies while Detroit's Comerica Park has trended toward greater home run suppression in recent years.
National League Patterns and Market Adjustments
National League East ballparks include Citi Field with its deep outfield gaps that reduce home run frequency and this leads to lower prop expectations for visiting power hitters while Philadelphia's Citizens Bank Park features shorter distances in several sectors that elevate totals. Research indicates that Atlanta's Truist Park maintains moderate dimensions that produce steady output without extreme swings and Washington Nationals venues show similar consistency in data sets.
The National League Central features contrasting environments with Wrigley Field's ivy covered walls and variable wind patterns that can either aid or hinder home runs depending on direction while Milwaukee's American Family Field offers a retractable roof system that stabilizes conditions. Prop markets account for these variables by referencing multi year averages that reveal St. Louis Cardinals home games at Busch Stadium producing slightly suppressed home run rates compared to league norms.
Western Divisions and Altitude Influences
American League West parks demonstrate notable contrasts because Oakland's Coliseum maintains larger outfield spaces that limit home run production whereas Seattle's T Mobile Park combines marine layer effects with deep fences to create one of the league's more pitcher friendly environments and these factors lead to conservative line settings for visiting sluggers. Texas Rangers at Globe Life Field encounter a retractable roof venue with shorter distances that boost totals and market makers adjust player props accordingly based on historical splits.
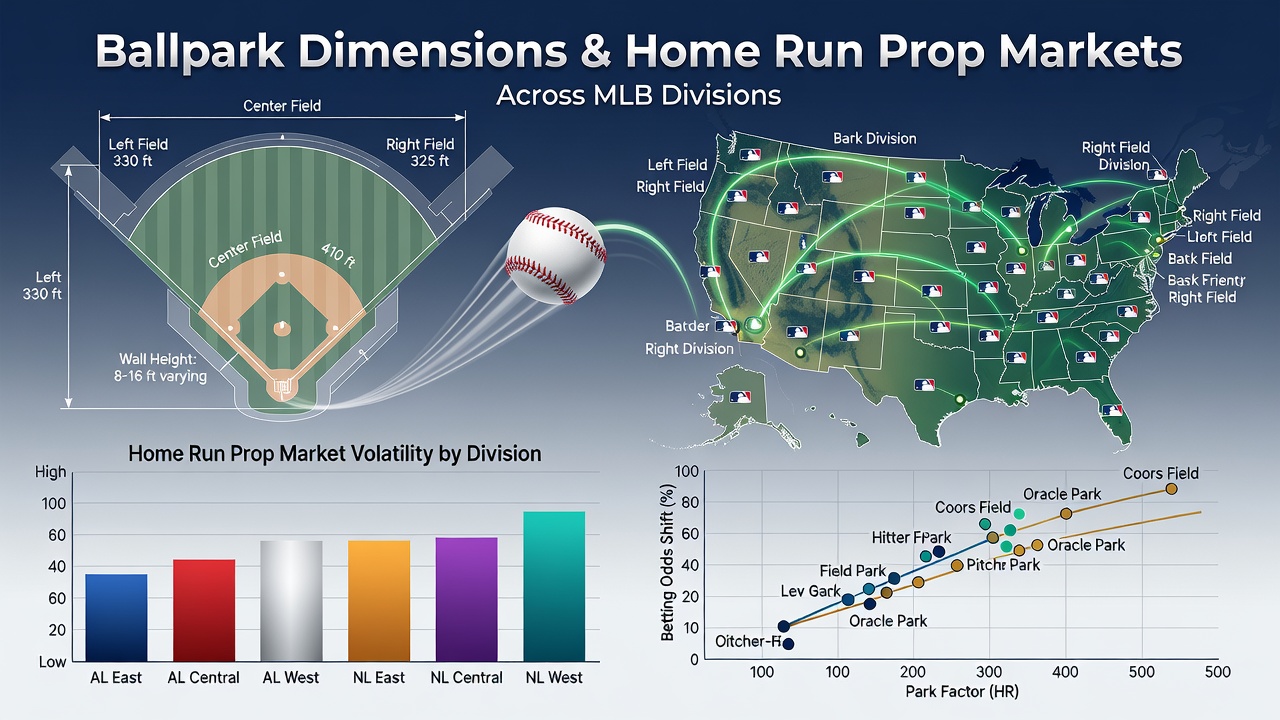
National League West venues produce the most pronounced dimension effects with Coors Field in Denver standing out due to its 5,280 foot elevation that increases home run rates by expanding batted ball distance significantly and this leads to elevated prop lines for both home and visiting hitters. Data shows that Los Angeles Dodgers at Dodger Stadium benefit from spacious outfields that reduce home run frequency while San Diego's Petco Park similarly suppresses power numbers through its large dimensions and marine influenced air density.
Division Wide Data Trends in July 2026
Through the first half of the 2026 season league tracking systems recorded the highest home run per game rates in National League West venues followed by American League East parks while Central divisions showed more moderate outputs and these patterns directly inform how sportsbooks construct home run props for individual players. Figures reveal that batters with multi year samples in hitter friendly parks receive adjusted over lines that reflect park specific boosts whereas pitchers scheduled for starts in those same venues see their allowed home run props moved upward to account for environmental factors.
Studies compiled by baseball analytics groups demonstrate that wall height variations add another layer because shorter fences in certain right field corners convert warning track flies into home runs more frequently and this detail influences daily prop construction across divisions. What's interesting is how these adjustments create opportunities for comparative analysis between divisions where similar player profiles face different dimension challenges on a given night.
Conclusion
Ballpark dimensions continue to serve as foundational inputs for home run prop markets because they provide measurable and consistent influences on offensive output that persist across seasons and divisions. Researchers maintain databases that update park factors annually while market operators integrate these metrics into line setting processes that reflect both venue characteristics and player specific tendencies. The interplay between physical stadium features and betting market responses remains a core element of how outcomes are projected in Major League Baseball.