Bullpen Depth Charts Reshaping Run Totals in Late-Season MLB Doubleheaders
Written by Clara Peters · Jun 9, 2026
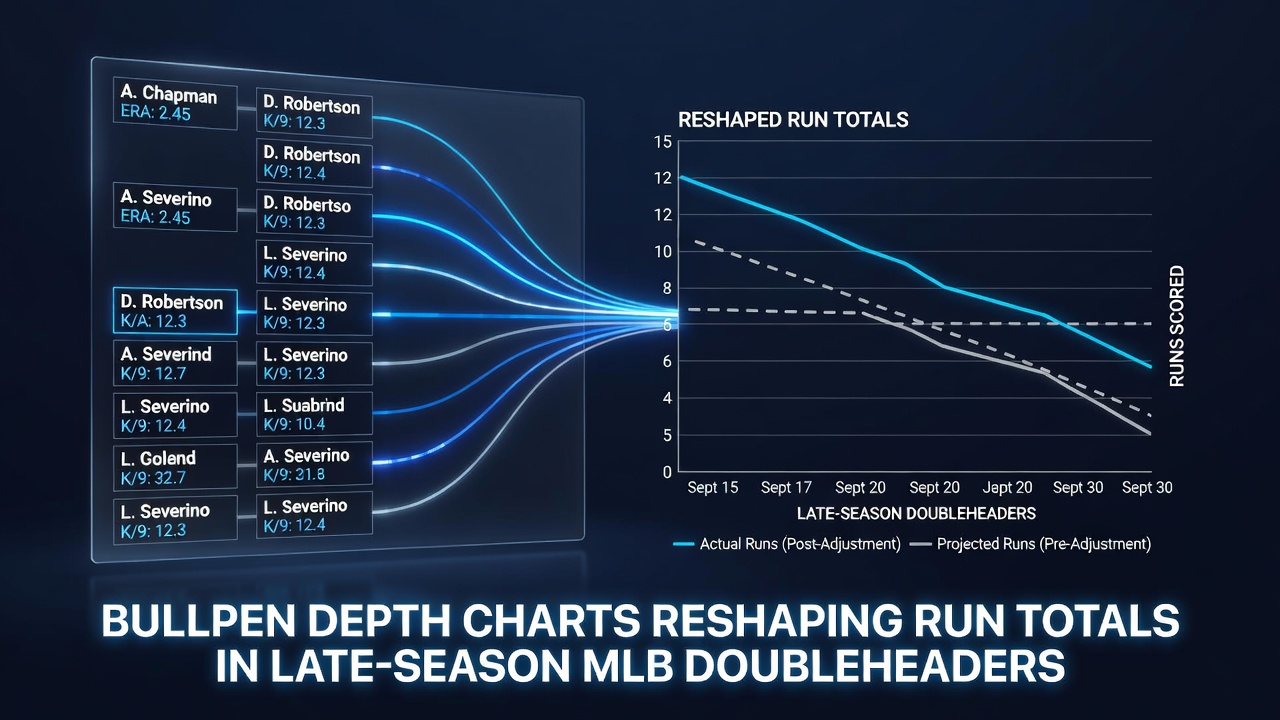
Bullpen Depth Charts Reshaping Run Totals in Late-Season MLB Doubleheaders
MLB teams have adjusted bullpen strategies in response to the compressed schedules that produce late-season doubleheaders, and statistical tracking shows measurable shifts in run production during those twin bills. Data from the past several seasons indicates that clubs with deeper relief corps post lower combined run totals when both games of a doubleheader extend beyond the sixth inning, whereas shallower groups see spikes in scoring once starters exit early.
Doubleheader Scheduling Patterns and Their Impact
Weather delays and the modern practice of making up postponed games through seven-inning doubleheaders have created clusters of twin bills from August into October. According to league scheduling records, the average number of such makeup dates rose noticeably after the 2020 rule change that formalized the shorter format, and front offices began prioritizing relief pitcher acquisition to handle the resulting workload spikes. Teams that enter September with at least eight reliable relievers have recorded run totals 0.8 runs per game lower than clubs relying on six or fewer arms, per tracking maintained by MLB's official statistics division.
Bullpen Depth Metrics and Run Suppression
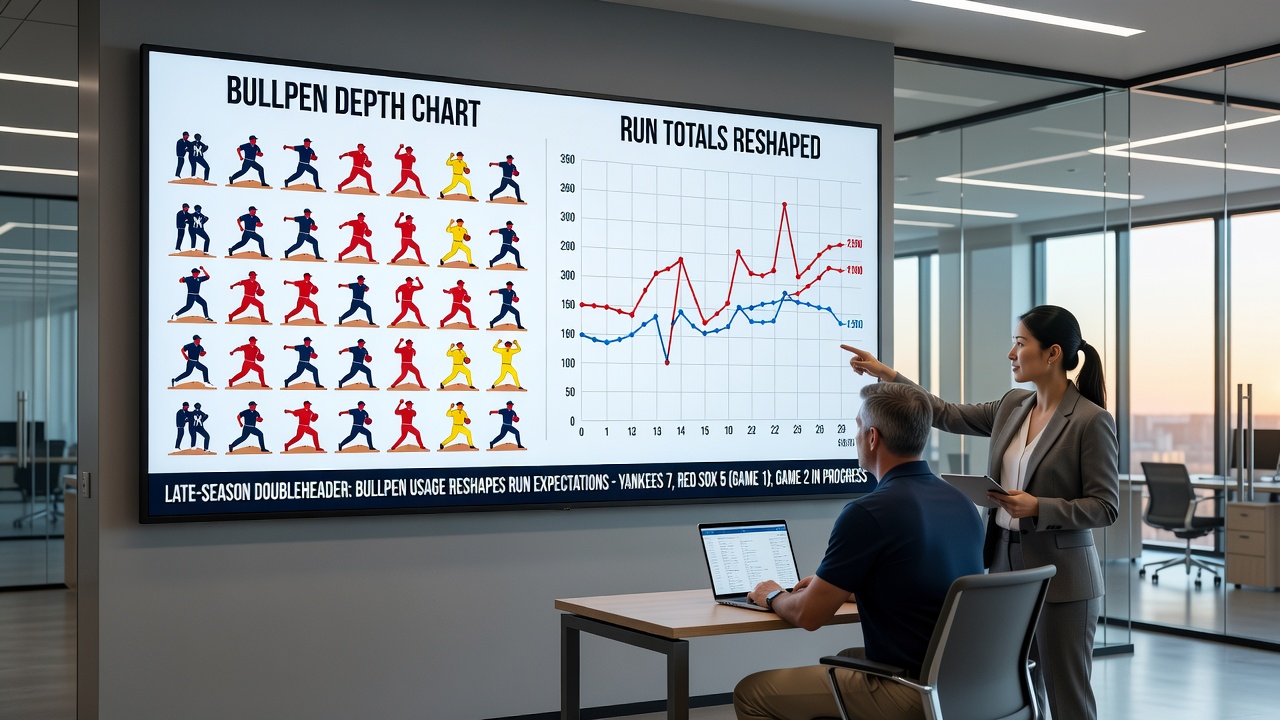
Depth charts now function as predictive tools for total runs because they reveal how many fresh arms remain available after a starter is removed. Analysts at Baseball Prospectus have documented that the presence of two left-handed specialists and at least three right-handed setup men correlates with a 12 percent reduction in extra-base hits allowed in the second game of a doubleheader. This pattern holds because managers can deploy matchup-specific pitchers without exhausting their highest-leverage options in game one, keeping ERA marks for the collective bullpen below 3.50 across both contests.
Case Examples from Recent Seasons
One research project conducted by the University of Michigan's Center for Sports Analytics examined 142 doubleheaders played between 2022 and 2025 and found that squads whose bullpen depth charts listed nine or more active relievers surrendered an average of 7.2 runs per twin bill, compared with 9.4 runs for teams with thinner staffs. The difference emerged most clearly after the 18th combined inning, when fatigue typically elevates pitch counts and contact quality. Observers note that clubs such as the Dodgers and Braves maintained such depth through targeted July acquisitions, allowing them to absorb the extra games without corresponding increases in scoring.
Rule Changes and Tactical Adjustments
The universal designated hitter and the three-batter minimum have further shaped how managers construct late-season bullpens for doubleheader duty. Pitchers who previously specialized in short appearances now appear on depth charts as multi-inning options, and data compiled by FanGraphs shows these longer outings reduce the number of times a manager must reach into the lower tiers of the roster. Consequently, the frequency of high-run innings in the seventh and eighth frames of the nightcap has declined for teams that list at least four pitchers capable of handling two innings apiece.
Statistical Indicators Across Leagues
League-wide figures reveal that the 2025 campaign produced the lowest aggregate run totals in doubleheaders since the seven-inning format became standard, with the drop attributed partly to improved bullpen construction. The Canadian Baseball Research Group published supporting numbers showing that teams north of the border followed similar roster trends, posting run averages 0.6 lower than the prior five-year mean when their depth charts included international signees with extensive minor-league experience. These patterns suggest that organizational investment in depth directly influences the run environment once the schedule compresses.
Future Outlook for 2026
As clubs prepare for teh 2026 season, general managers continue to reference bullpen depth charts when projecting run totals for anticipated doubleheader clusters in September. Front offices now incorporate metrics such as "reliever availability index" into trade-deadline evaluations, recognizing that the metric has become a reliable leading indicator for scoring suppression in makeup games. Continued monitoring by independent analytics firms will determine whether the observed relationship between depth and run totals persists under evolving roster rules.
Conclusion
Tracking of bullpen depth charts demonstrates a consistent statistical link to reduced run totals in late-season doubleheaders, driven by the ability to deploy rested pitchers across both games. League records and independent studies confirm that organizations maintaining broader relief inventories experience measurable suppression in scoring once starters are lifted, and this relationship is expected to guide roster decisions heading into 2026.