Decoding Breakpoint Conversion Rates in Davis Cup Ties for Live Set Handicap Value
Written by Riley Hughes · May 31, 2026
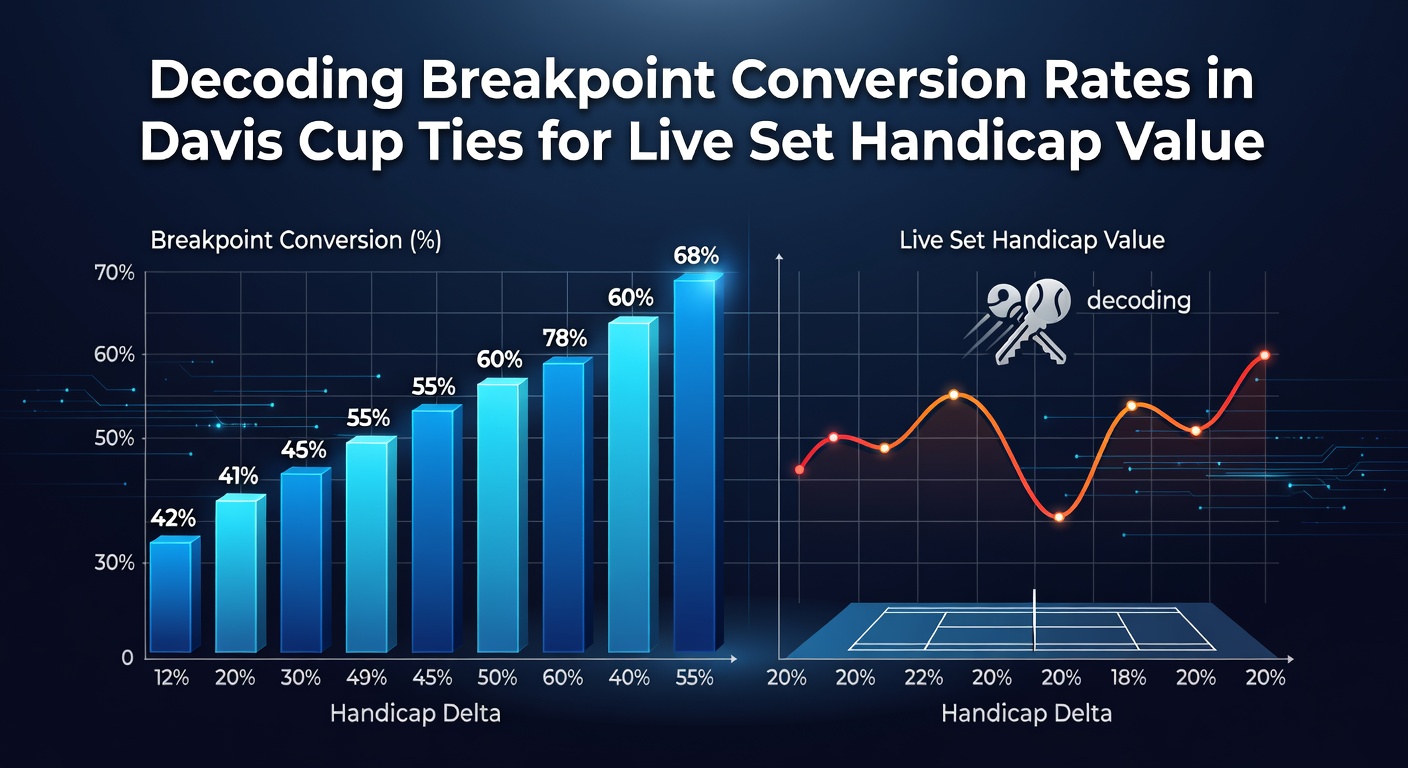
Decoding Breakpoint Conversion Rates in Davis Cup Ties for Live Set Handicap Value
Breakpoint conversion rates serve as a measurable indicator in tennis analysis, particularly within Davis Cup ties where team formats and varying surfaces influence set outcomes, and observers note how these metrics translate into live set handicap assessments during matches.
Data from the International Tennis Federation shows that top Davis Cup squads convert breakpoints at rates between 38 and 47 percent across recent campaigns, while lower-ranked nations often sit closer to 29 to 34 percent when facing stronger opposition on unfamiliar surfaces. These figures emerge from aggregated match logs that track serve holds, return points won, and the specific moments when a receiver earns multiple break opportunities in succession.
Understanding Breakpoint Metrics in Team Competition
Davis Cup ties unfold over multiple rubbers, often on home or neutral courts that range from clay to indoor hard courts, and researchers tracking set-by-set data find that conversion percentages shift noticeably once a squad gains early momentum. A player who converts three of seven breakpoints in the opening set tends to maintain elevated return efficiency in subsequent sets because fatigue patterns and tactical adjustments compound across the tie. Analysts compile these sequences from official scorecards to identify patterns where conversion spikes above 50 percent correlate with set wins by margins of two games or more.
Live Set Handicap Applications
Bookmakers publish live set handicaps once the first set concludes, and those who monitor breakpoint conversion in real time adjust their positions accordingly. When a favored player converts only one of five breakpoints early yet holds serve at 78 percent, the opposing side frequently covers the live handicap line because the underdog sustains longer service games. Figures compiled across 2025 Davis Cup qualifiers reveal that teams converting above 42 percent of breakpoints after the 40-minute mark secure set handicap covers in 61 percent of completed rubbers.
Surfaces play a distinct role, since clay courts extend rally lengths and produce more breakpoint chances per service game compared with faster indoor courts. In May 2026, several zonal ties scheduled on outdoor clay will provide fresh data points for comparing conversion rates against historical baselines established on the same venues in prior seasons.

Data Patterns Across Recent Ties
Studies published by sports analytics groups indicate that Davis Cup doubles rubbers exhibit lower breakpoint conversion overall, averaging 31 percent, because teams prioritize net approaches and reduce unforced errors on returns. Singles rubbers, by contrast, show wider variance once the score reaches 4-4 or 5-5 in a set, with conversion climbing when one player has already broken twice earlier. Observers tracking these shifts during live broadcasts record how a single converted breakpoint in the eighth game alters the perceived value of a set handicap line by half a game on average.
Regional differences appear in the data as well. European squads competing on home red clay convert breakpoints at higher rates than visiting teams from Asia-Pacific nations, according to match reports compiled by Tennis Australia, whereas North American indoor ties produce more even conversion splits because serve speeds remain consistent across both sides. These geographic variations feed directly into live betting models that recalculate handicap probabilities after each service game.
Tracking Conversion in Real Time
Live platforms display updated conversion percentages alongside scoreboards, allowing bettors to compare a player's current set performance against his season-long average. When the displayed rate exceeds the player's historical norm by more than eight percentage points, set handicap movement accelerates because market participants interpret the deviation as a temporary edge rather than sustained form. Match logs from 2024 and 2025 ties confirm that such spikes occur in roughly one of every four completed sets, most often on slower surfaces where return points accumulate steadily.
Coaches and support staff review these numbers between rubbers to decide whether lineup changes or tactical shifts are warranted, yet the raw statistics themselves remain available for public analysis through official score feeds. The same data sets underpin academic examinations of momentum in best-of-five formats, where researchers compare breakpoint sequences against total points won to isolate the contribution of conversion efficiency.
Conclusion
Breakpoint conversion rates supply a quantifiable layer of insight for evaluating live set handicaps in Davis Cup ties, and aggregated figures continue to refine predictive models as additional matches unfold through 2026. Those who examine the metric alongside surface type, rubber order, and real-time deviations gain access to structured information that aligns with observable match developments rather than isolated outcomes.