Examining Travel Fatigue Metrics in Cross-Country College Basketball for Sharper Spread Wagers
Written by Ines Friedrich · May 22, 2026
Examining Travel Fatigue Metrics in Cross-Country College Basketball for Sharper Spread Wagers
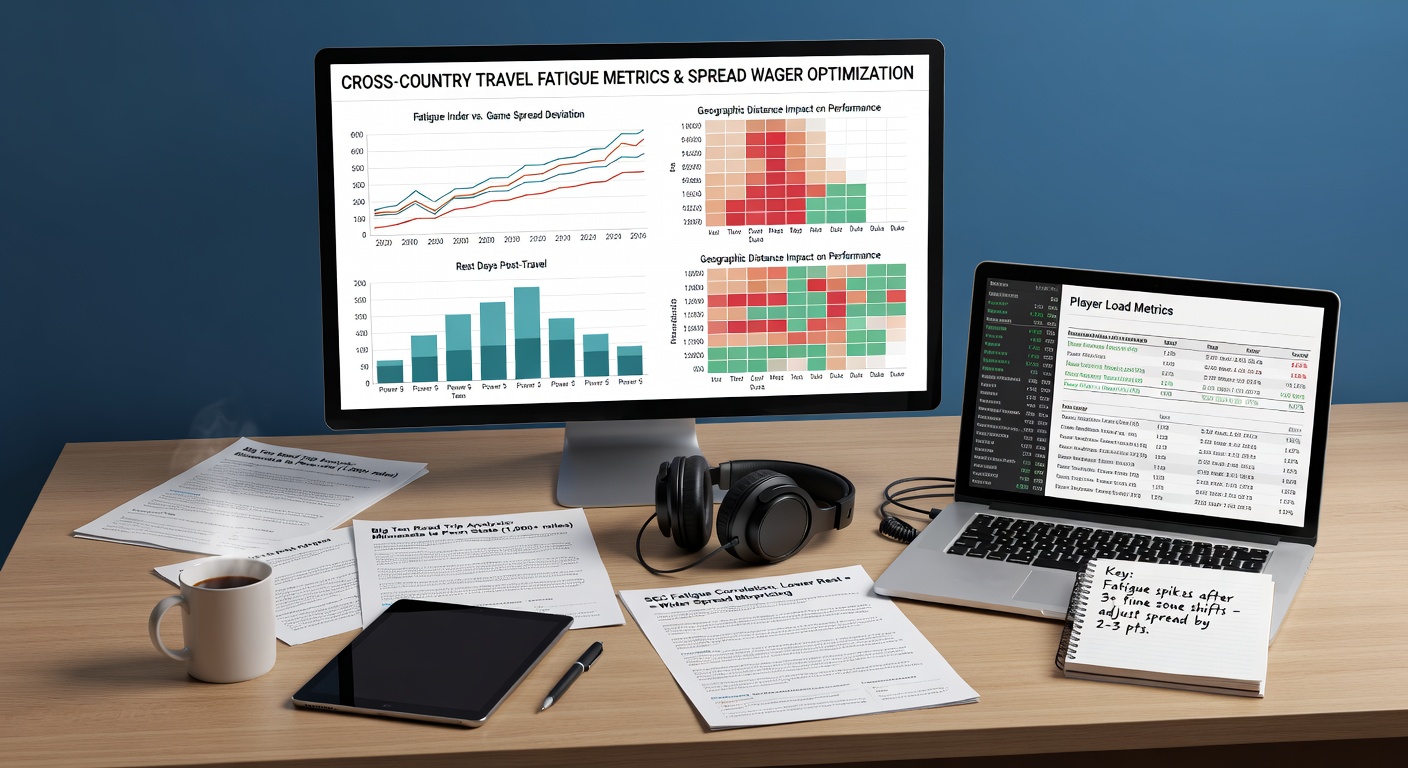
Cross-country travel in college basketball creates measurable shifts in team performance that directly influence point-spread outcomes, and researchers continue to track these patterns through detailed distance logs combined with recovery timelines. Data from recent seasons shows that squads flying more than 1,500 miles for a midweek contest often post lower shooting percentages and reduced defensive efficiency ratings compared with their season averages, while those same squads rebound in subsequent games once rest exceeds 48 hours. Observers note that Atlantic Coast Conference programs traveling to Pacific-12 venues historically cover the spread at lower rates than expected, particularly when tip-off occurs within 24 hours of arrival.
Coaches and analysts compile fatigue metrics that include total air miles, time-zone changes, back-to-back scheduling, and prior-game workload. These indicators feed into predictive models used by professional handicappers who adjust spreads when a visiting team logs excessive travel without an intervening rest day. Studies conducted by university sports-science departments have quantified average drops of 4 to 7 points in offensive output for teams crossing two or more time zones on the day of a game, and those decrements frequently widen the margin beyond the closing line.
Key Travel Variables Tracked by Analysts
Distance traveled ranks as the most straightforward variable, yet its impact grows when paired with additional factors such as departure time, flight duration, and altitude changes upon landing. Teams departing before dawn for a cross-country flight commonly experience circadian disruption that lingers into the evening tip, and records compiled by analytics groups indicate that such squads allow opponents to shoot 3 percent higher from the field than their seasonal norms. Time-zone differential adds another layer because a three-hour shift alters sleep patterns and meal timing, both of which influence reaction speed and foul rates during the first half.
- Total air miles logged since the previous game
- Number of time zones crossed within 48 hours
- Hours between arrival and tip-off
- Back-to-back road contests versus single-game trips
- Altitude differential between home arena and visiting venue
Those variables appear in public datasets released each spring, allowing bettors to compare historical ATS results against the same travel profiles. One dataset released in May 2026 covering the prior five seasons highlighted that teams traveling over 2,000 miles on zero days rest covered the spread in fewer than 38 percent of instances when facing opponents with at least one full day between games.
Performance splits become sharper when broken down by conference and schedule density. Mid-major programs making rare long-haul trips often suffer steeper declines because they lack the charter resources and recovery staff available to power-conference opponents. In contrast, major-conference teams equipped with advanced sleep-monitoring technology sometimes mitigate fatigue effects, though even those squads post measurable dips in rebounding percentage after extended flights. Handicappers therefore cross-reference travel logs with Ken Pomeroy efficiency ratings to isolate edges that standard lines overlook.
Integrating Fatigue Data into Spread Models
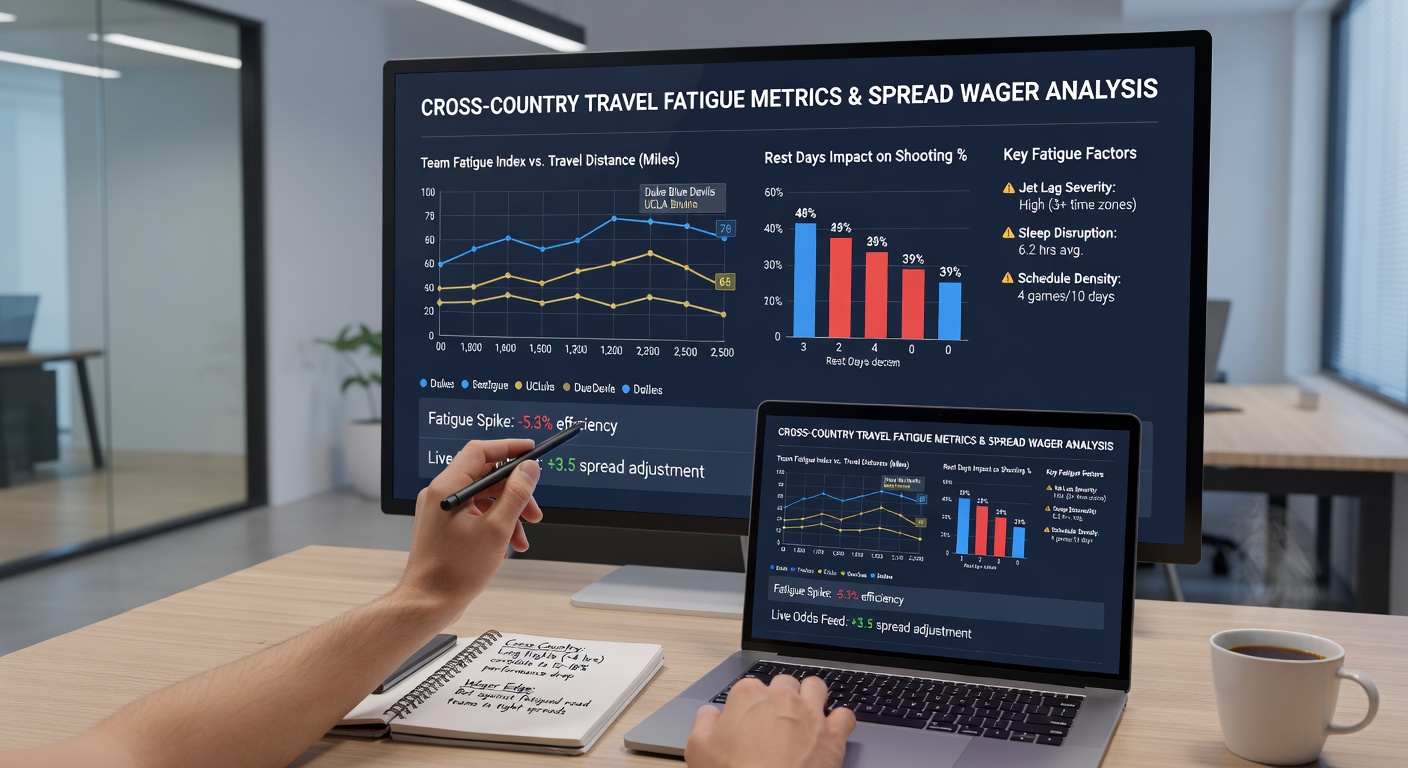
Quantitative bettors build regression frameworks that treat cumulative travel distance as an independent variable alongside home-court advantage and rest differentials. When these models flag a visiting team whose fatigue score exceeds a calibrated threshold, the adjusted spread typically moves one to three points in favor of the home side. Public bettors who ignore these adjustments frequently land on the wrong side of late line movement because sharp money responds to updated travel reports released 24 to 36 hours before tip.
Real-world examples illustrate the pattern. During the 2024-2025 campaign, a West Coast team flew overnight from California to the Northeast for a conference matchup, arrived less than 18 hours before tip, and ultimately lost by 11 points after entering the game as a 4-point underdog. Subsequent analysis revealed that the same program had covered only 29 percent of its spreads in comparable travel scenarios over the prior three seasons, prompting several sportsbooks to shade the line further the next time similar conditions arose.
Conference scheduling offices have begun publishing tentative travel itineraries earlier each year, giving analysts additional lead time to run simulations. Data released ahead of the 2026-2027 slate already shows several high-profile cross-country trips scheduled with minimal rest windows, creating advance opportunities for those who monitor mileage thresholds. Regulatory bodies such as the National Collegiate Athletic Association maintain oversight on scheduling practices, yet the emphasis remains on competitive balance rather than betting implications.
External Research and Data Sources
Academic institutions contribute peer-reviewed findings that strengthen travel-fatigue models. A longitudinal study from the University of Oregon's human physiology department tracked Division I athletes across multiple seasons and documented consistent declines in vertical leap and sprint recovery when travel exceeded 1,200 miles without adequate rest. Those physiological markers correlate directly with on-court statistics used in spread calculations. Meanwhile, reports issued by the Australian Institute of Sport highlight comparable patterns in other time-zone-heavy sports, offering cross-disciplinary benchmarks that basketball analysts adapt for NCAA contexts.
Combining these sources with real-time box-score aggregation produces actionable thresholds. Teams whose pre-travel efficiency rating sits within five points of the opponent yet face a three-time-zone trip on short rest rarely exceed 45 percent ATS success over large sample sizes. Bettors who layer such filters onto standard power ratings generate narrower but higher-percentage edges that compound across a season.
Conclusion
Travel-fatigue metrics supply a repeatable framework for refining spread wagers in cross-country college basketball, and continued data collection through 2026 will likely sharpen those thresholds further. Analysts who integrate distance logs, time-zone differentials, and recovery windows with established efficiency ratings identify line movements that casual observers miss. As scheduling patterns evolve and technology improves recovery protocols, the core relationship between extended travel and diminished performance remains a stable input for informed betting decisions.