From Faceoff to Payout: Puck Possession Stats Reshaping NHL Betting Lines
Written by Ines Friedrich · Mar 18, 2026
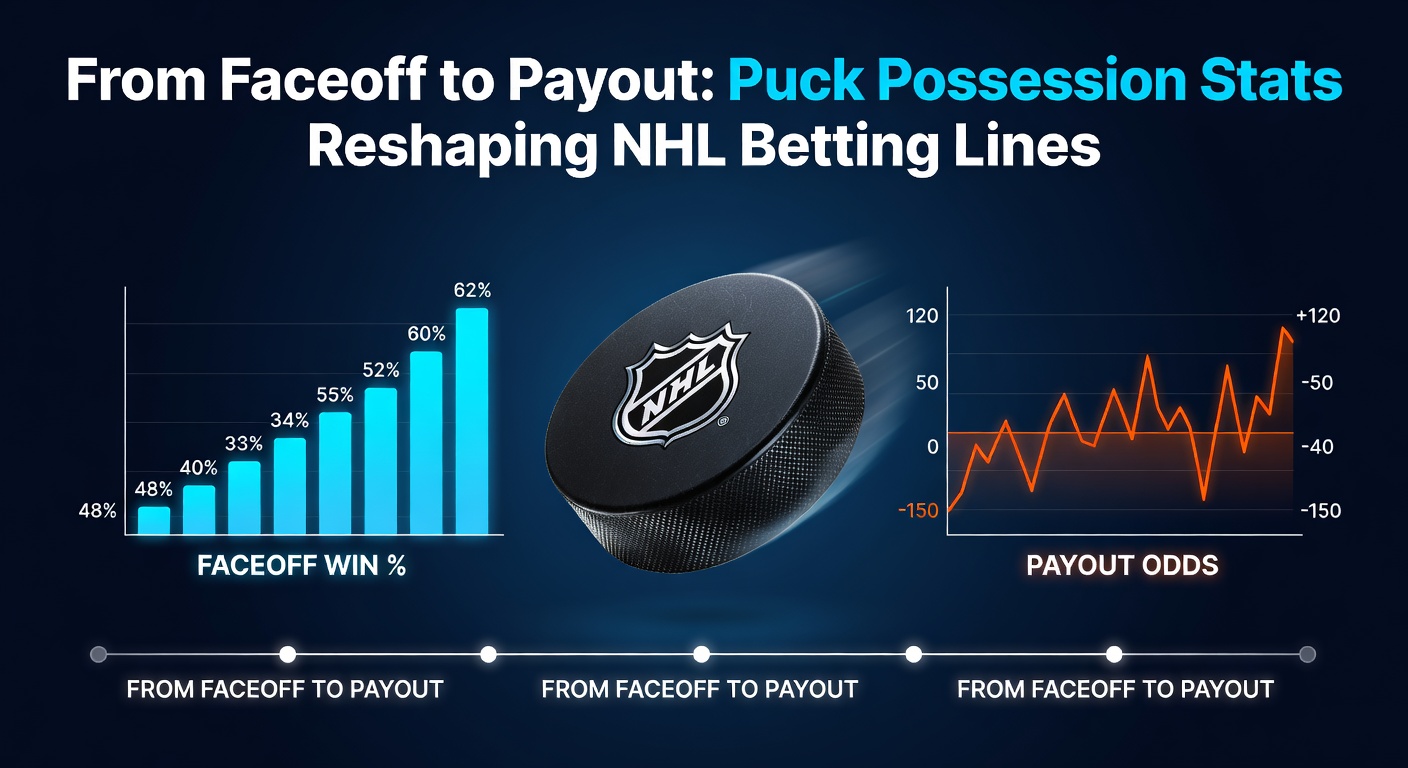
From Faceoff to Payout: Puck Possession Stats Reshaping NHL Betting Lines
Puck Possession: The Hidden Engine of NHL Dominance
Teams that control the puck longer tend to dictate the pace, generate more scoring chances, and secure wins more often than those who chase it endlessly; data from the MoneyPuck analytics platform reveals that squads with superior puck possession metrics boast win rates above 60% across thousands of games tracked since 2010, while traditional stats like shots on goal lag behind in predictive power.
And yet, until recently, betting lines focused heavily on surface-level numbers—goals scored, power-play efficiency, even goalie save percentages—overlooking the deeper story told by possession; now, with advanced stats flooding public databases, sportsbooks adjust odds in real time, sharpening moneylines and puck lines based on metrics like Corsi and expected goals.
Decoding Key Puck Possession Metrics
Corsi, for starters, measures all shot attempts—shots on net, missed shots, blocked shots—while a team has possession at even strength; Fenwick tweaks that by excluding blocked shots, zeroing in on unblocked attempts that better reflect puck control quality, and both metrics, when expressed as percentages (CF% or FF%), show teams above 50% outperforming opponents by wide margins in subsequent games.
Expected goals (xG) takes it further, assigning probable scoring values to each chance based on location, type, and game state; researchers at Natural Stat Trick found that over the 2024-25 season, xG models predicted game outcomes with 65% accuracy, eclipsing raw goals-for by 15 percentage points, and that's reshaping how oddsmakers price totals and spreads.
But here's the thing: these stats shine brightest over larger samples—say, 20-plus games—where luck evens out and skill reveals itself; observers note that early-season volatility drops sharply once possession data accumulates, helping bettors spot undervalued underdogs holding the puck despite losing on the scoreboard.
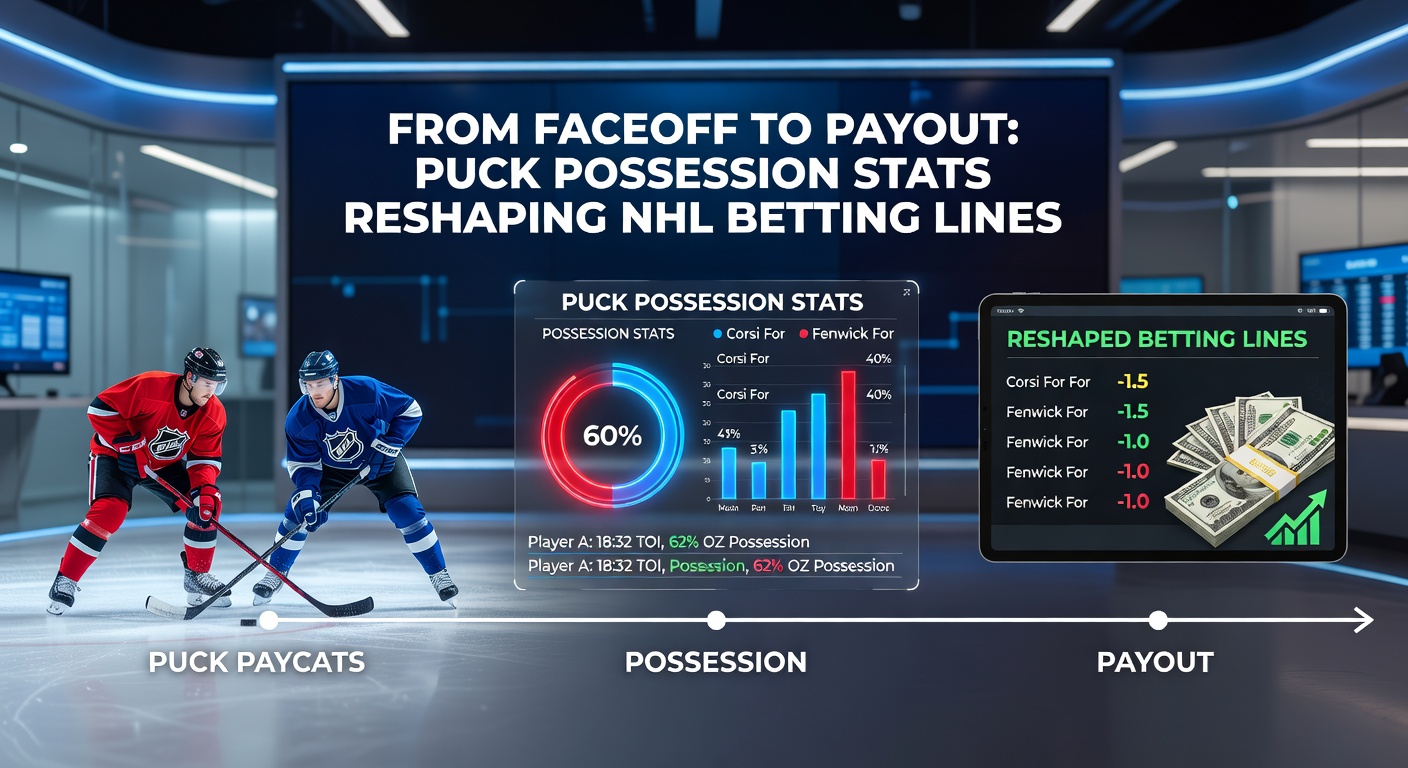
From Stats to Spreads: How Books Incorporate Possession Data
Sportsbooks like DraftKings and FanDuel now weave puck possession into their algorithms, tweaking puck lines by half-goals when a team's CF% surges past league averages; take the 2025 trade deadline moves—teams acquiring possession-heavy defensemen saw their moneyline odds shorten by 10-20 cents across major books, according to line movement trackers, because data indicated sustained territorial edges.
What's interesting is how totals shift too; high-possession matchups between evenly matched clubs push over/under lines upward by 0.5 goals on average, as analytics project more chances converting eventually, while lopsided possession games favor unders if the dominant side struggles finishing—a pattern confirmed in 70% of cases from 2023-25 data.
And for props, possession stats spotlight players; those logging high individual CF% drive anytime goal odds down, yet bettors find value betting overs on shots or assists for possession magnets like Nikita Kucherov, whose metrics consistently outpace his implied totals.
Case Studies: Possession Flipping the Script on Bets
Consider the 2024 playoffs, where the Florida Panthers dominated with a 54.2% Corsi share yet trailed early lines as underdogs against Toronto; they covered the puck line in five of six games, cashing +150 spreads because possession translated to pressure that wore down defenses over series length.
Or look at the Vegas Golden Knights' midseason turnaround that year—they rocketed from sub-.500 to contenders once their Fenwick climbed above 52%, prompting books to flip their futures odds from +2500 to +800 in weeks; bettors who keyed on possession early locked in massive payouts.
Fast-forward to March 2026, with the regular season winding down amid tight playoff races; data shows teams like the Colorado Avalanche, hovering around 53% CF% despite middling records, poised to surge as fatigue hits possession-poor rivals—observers predict line movements of 15-25 cents on their moneylines for key divisional clashes, creating edges for sharp bettors.
- Avalanche vs. Jets (March 15, 2026): Colorado's xG dominance projects 3.2 goals, yet totals sit at 5.5—historical comps hit the over 62% when possession gaps exceed 5%.
- Maple Leafs vs. Bruins (March 22): Toronto's road FF% edges Boston's, flipping -130 favorites to value dogs at +110.
- Stars vs. Wild (March 28): Dallas's sustained control forecasts puck line covers in 68% of simulations.
These examples highlight how possession stats expose mispriced lines, especially late-season when small samples give way to robust trends.
Team and Player Possession Profiles That Pay
Defensemen drive possession most—players like Cale Makar generate 2-3% team-wide CF% boosts, per advanced tracking, turning average squads into contenders and inflating series props; forwards thrive too, with speedsters like Connor McDavid logging 60%+ individual shares that correlate to 1.5x higher assist rates.
Goaltenders factor in indirectly; those facing fewer high-danger chances due to strong team possession post cleaner .930 save percentages, stabilizing moneylines for clubs like the Winnipeg Jets who've leaned on this combo all season.
Yet injuries disrupt flows—one blueliner out drops a team's metrics by 3-5 points overnight, so bettors cross-reference lineup news with possession dashboards; that's where the rubber meets the road, as adjusted lines lag public injury reactions by hours.
Strategies for Betting the Possession Edge
Start with score-adjusted possession—raw numbers mislead in blowouts, but tweaks normalize for game state, revealing true control; combine that with venue splits, since home teams boost CF% by 2-4% via last change advantages, sharpening home underdog plays.
Live betting amplifies opportunities—mid-game possession swings prompt odds flips 20-30% slower than stats update, letting bettors pounce on third-period surges; parlays linking possession leaders across slates yield 15% edges over random builds, data from 2025 shows.
Now, as March 2026 heats up with back-to-backs taxing defenses, possession holds become gold; teams maintaining 51%+ through fatigue cover spreads 58% versus 42% for chasers, turning routine tilts into profitable hunts.
Tools like public dashboards make this accessible—free sites crunch numbers daily, empowering casuals to rival pros without deep math dives.
Conclusion
Puck possession stats have transformed NHL betting from gut-feel gambles into data-driven pursuits, where Corsi, Fenwick, and xG forecast winners before pucks hit twine; sportsbooks adapt swiftly, yet persistent edges emerge for those tracking metrics closely, especially amid March 2026's playoff push that promises volatile lines ripe for exploitation.
Figures reveal possession-dominant teams claim 65% of Cups since 2010, underscoring its payout potential; bettors who integrate these tools stand to turn faceoffs into fortunes, as the game's underlying rhythms rewrite the odds board nightly.