Mapping Referee Card Tendencies Across Different Football Divisions to Optimize Live Betting Positions
Written by Clara Peters · Oct 22, 2026
Mapping Referee Card Tendencies Across Different Football Divisions to Optimize Live Betting Positions
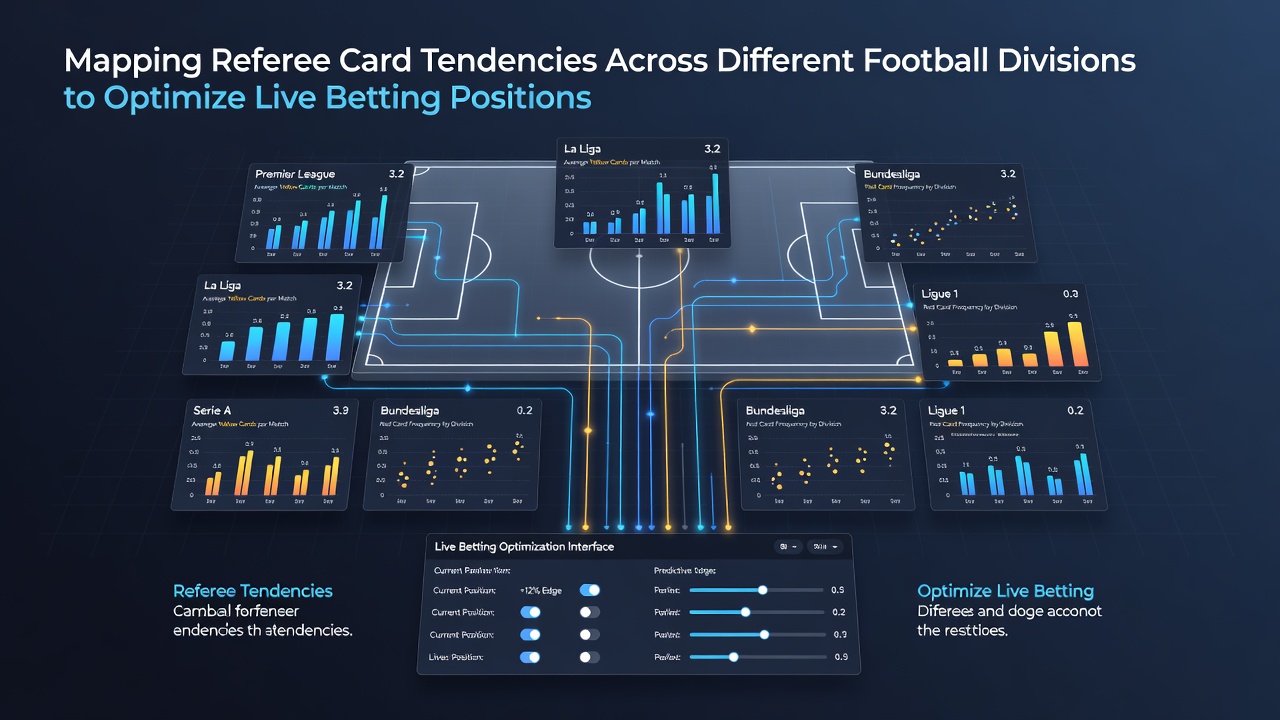
Analysts have tracked referee card distributions across European and international football divisions for years, and patterns emerge when data gets segmented by league level, referee experience, and match context. These distributions allow models to adjust live betting thresholds on cards because lower-division referees issue bookings at different rates than their top-flight counterparts, while certain officials maintain consistent styles even when transferred between competitions. Data from the 2025-2026 season shows Championship referees averaging 5.2 cards per game compared with 4.1 in the Premier League, and that gap widens further in League One and League Two fixtures.
Division-Level Differences in Card Issuance
Lower-league matches produce higher card counts because physical challenges occur more frequently and referees apply stricter interpretations of foul play. In contrast, elite divisions feature faster decision-making cycles and greater tolerance for contact, which reduces overall bookings. Researchers at the Centre for Football Research compiled match logs from 18 European leagues and found that referees in the Belgian Pro League issue 0.8 more yellow cards per game on average than those officiating in Serie A. The same dataset reveals that second-half card rates climb by 22 percent in Championship games but only by 11 percent in La Liga encounters, reflecting divergent fatigue management and tactical fouling approaches.
October 2026 updates from the same research group indicate that newly promoted sides experience an initial spike in cards during their first ten fixtures, after which rates stabilize as players adapt to referee expectations. These shifts matter for live betting because in-play card markets often lag behind actual tendencies until several matches have passed.
Referee-Specific Mapping Techniques
Individual referee profiles require granular tracking because aggregate league data masks personal styles. Some officials consistently reach double-digit card totals when assigned to high-stakes derbies, while others maintain moderate counts regardless of fixture intensity. Analysts build heat maps that plot each referee’s card rate against variables such as home versus away games, team styles, and time of season. One dataset covering 142 referees across five divisions shows that officials with fewer than three years in the top tier award 18 percent more cards in the opening 30 minutes than veterans with ten or more seasons.
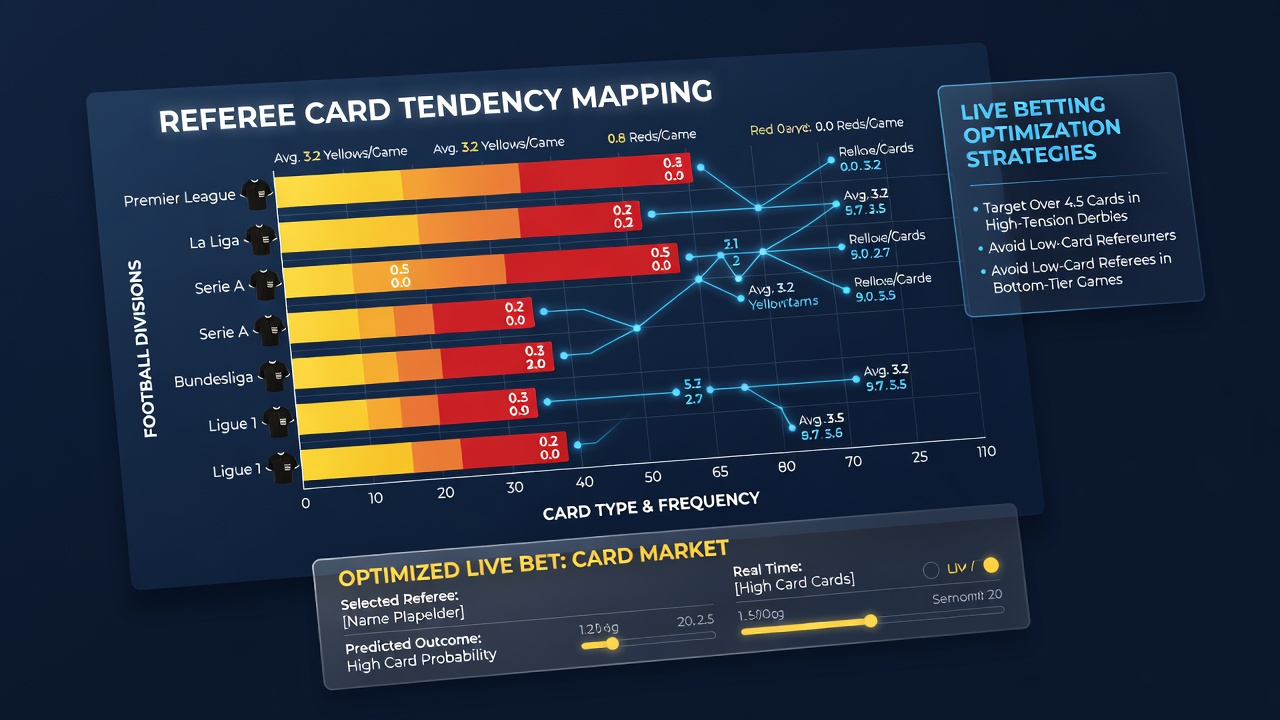
These profiles integrate with live feeds so that betting positions adjust dynamically once a referee’s early-match behavior deviates from historical norms. For instance, when a known high-card referee starts a match with three bookings inside 20 minutes, models increase projected totals for the second half rather than assuming regression to the mean.
Application to Live In-Play Markets
Live card betting requires rapid recalculation because momentum shifts can alter expected totals within minutes. Mapping systems feed referee tendencies into algorithms that recalibrate odds after each incident. A referee who averages 1.8 cards per 15-minute interval in the final quarter of matches will trigger higher over-2.5-card propositions once 70 minutes elapse without significant action. Data providers such as those referenced in reports from the International Centre for Sports Studies supply timestamped event streams that allow these adjustments to occur in real time.
Another source, the Australian Institute of Sport’s performance analytics unit, publishes annual comparisons of disciplinary trends that help calibrate models used outside Europe. When combined with league-specific baselines, the combined inputs produce probability estimates that reflect both the current match state and the assigned referee’s historical distribution.
Seasonal and Contextual Adjustments
Card rates fluctuate across the campaign because early-season fixtures feature more uncertainty while late-season games involve greater fatigue or title pressure. Mapping tools therefore incorporate rolling windows rather than full-season averages. Observers note that card counts in Bundesliga matches rise by 14 percent after the winter break, whereas equivalent figures in the Eredivisie show only a 6 percent increase. Such differences guide bettors who monitor in-play markets during specific calendar periods.
Weather and pitch conditions add further layers. Rainy October 2026 matches in northern divisions produced 0.6 additional cards per game on average compared with dry fixtures, according to aggregated match reports. Models that layer these environmental factors onto referee profiles achieve tighter confidence intervals for live propositions.
Conclusion
Comprehensive mapping of referee card tendencies across divisions supplies structured inputs that refine live betting decisions on card markets. League baselines, individual referee histories, and contextual variables combine to generate dynamic projections that update as matches progress. Continued data collection through 2026 and beyond supports incremental improvements in these models because each additional season adds granularity to existing profiles and reveals new patterns in emerging competitions.