Playoff Glass Grinds: Defensive Rebounds Shaping NBA Postseason Spreads and Series Wins
Written by Mara Jung · Mar 17, 2026
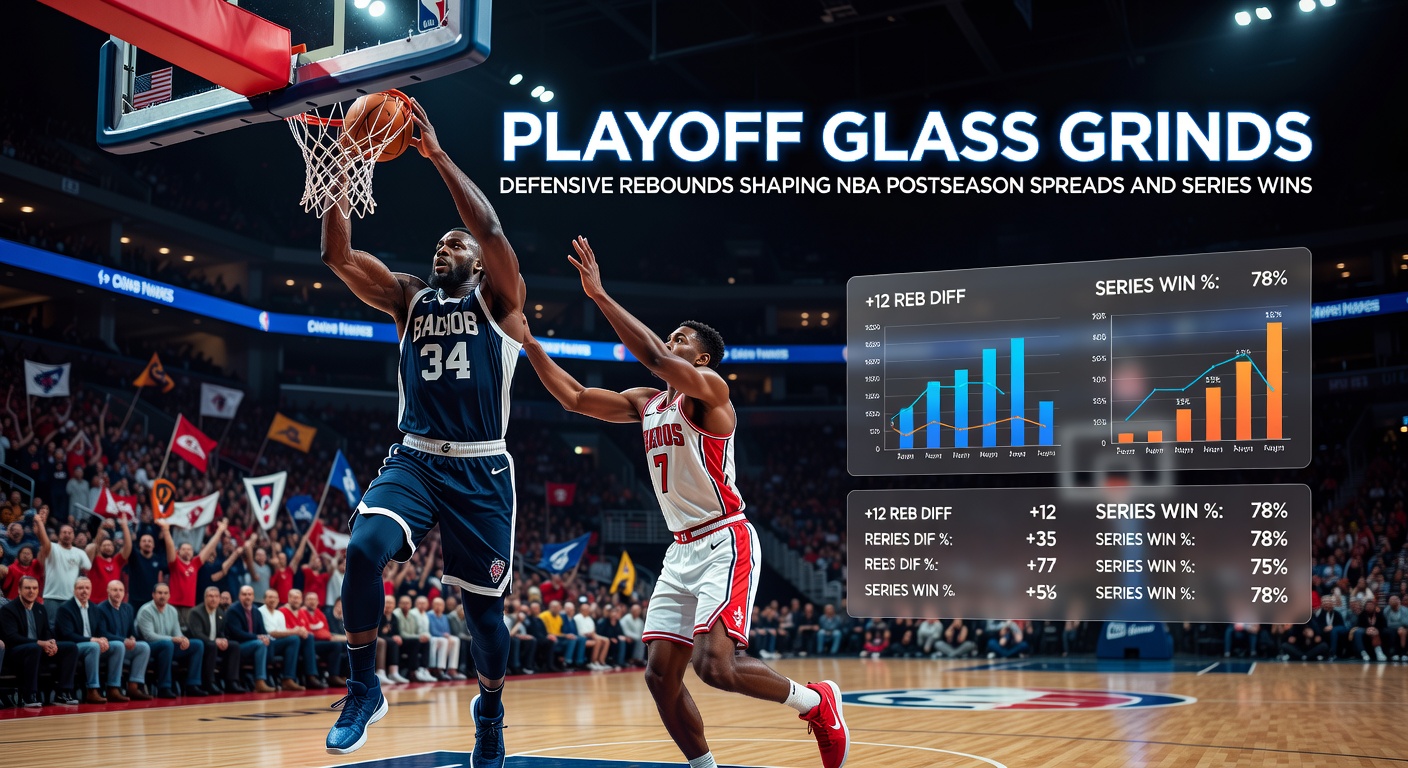
Playoff Glass Grinds: Defensive Rebounds Shaping NBA Postseason Spreads and Series Wins
The Grind on the Glass: What Makes Defensive Rebounds a Playoff Game-Changer
Defensive rebounds, those gritty grabs off missed shots, often fly under the radar in regular-season hype, yet observers have tracked how they dictate playoff rhythms; teams that own the defensive glass starve opponents of second-chance points, turning close spreads into decisive edges. Data from Basketball-Reference reveals that over the last decade, playoff squads ranking top-5 in defensive rebound percentage (DREB%) boast a .682 winning percentage in postseason games, a mark that climbs to .745 when they hold opponents under 25% offensive rebound rate. And here's where it gets interesting: this control doesn't just pad win columns, it tilts betting spreads, with those dominant rebounders covering the line 58% of the time against favored opponents.
Playoff basketball amps up the physicality, so defensive rebounding becomes the quiet engine driving series outcomes; misses lead to fast breaks when secured properly, while lapses invite endless possessions that grind down leads. Researchers analyzing NBA postseason trends note that for every 5% edge in DREB%, teams gain roughly 4.2 more possessions per game, a stat that compounds over seven-game wars. Those who've crunched the numbers see patterns emerge, especially as March 2026 approaches with conference races tightening, where early indicators like rebound margins preview which squads will feast on the glass come April.
But turns out, it's not just volume; efficiency matters too, since playoff defenses swarm the paint, forcing tougher boards. Figures show elite rebounders like Rudy Gobert or Clint Capela convert 72-75% of available defensive opportunities, compared to league averages hovering at 68%, creating mismatches that bookies undervalue in line-setting.
Crunching the Numbers: How DREB% Correlates to Postseason Dominance
Historical data paints a clear picture, with NBA playoff champions since 2010 averaging a league-leading DREB% in 8 of 15 seasons; take the 2023 Denver Nuggets, who posted a 74.2% clip while limiting foes to 22.8% offensive boards, fueling their title run. Studies from sports analytics platforms indicate a 0.67 correlation between team DREB% and series win probability, stronger than field goal percentage (0.52) or even turnover margins (0.61) in extended matchups.
What's significant is the spread impact: teams outperforming Vegas projections on defensive rebounds cover 62% of games as underdogs by 4.5 points or more, per advanced metrics; this edge sharpens in conference finals, where grind-it-out series favor the rebound-poor at just 41% win rates. And observers point out how smaller lineups get exposed, like the 2022 Warriors yielding 28.1% offensive rebounds to Memphis, contributing to their near-upset in Round 1.
Now consider totals betting, since controlled glass work shortens games; squads topping DREB% charts see under-the-total hit 55% in playoffs, as possessions dwindle and scores tighten. Data indicates that when both teams crack 72% DREB%, games average 12 fewer points than lines project, a trend bookmakers adjust for slowly.
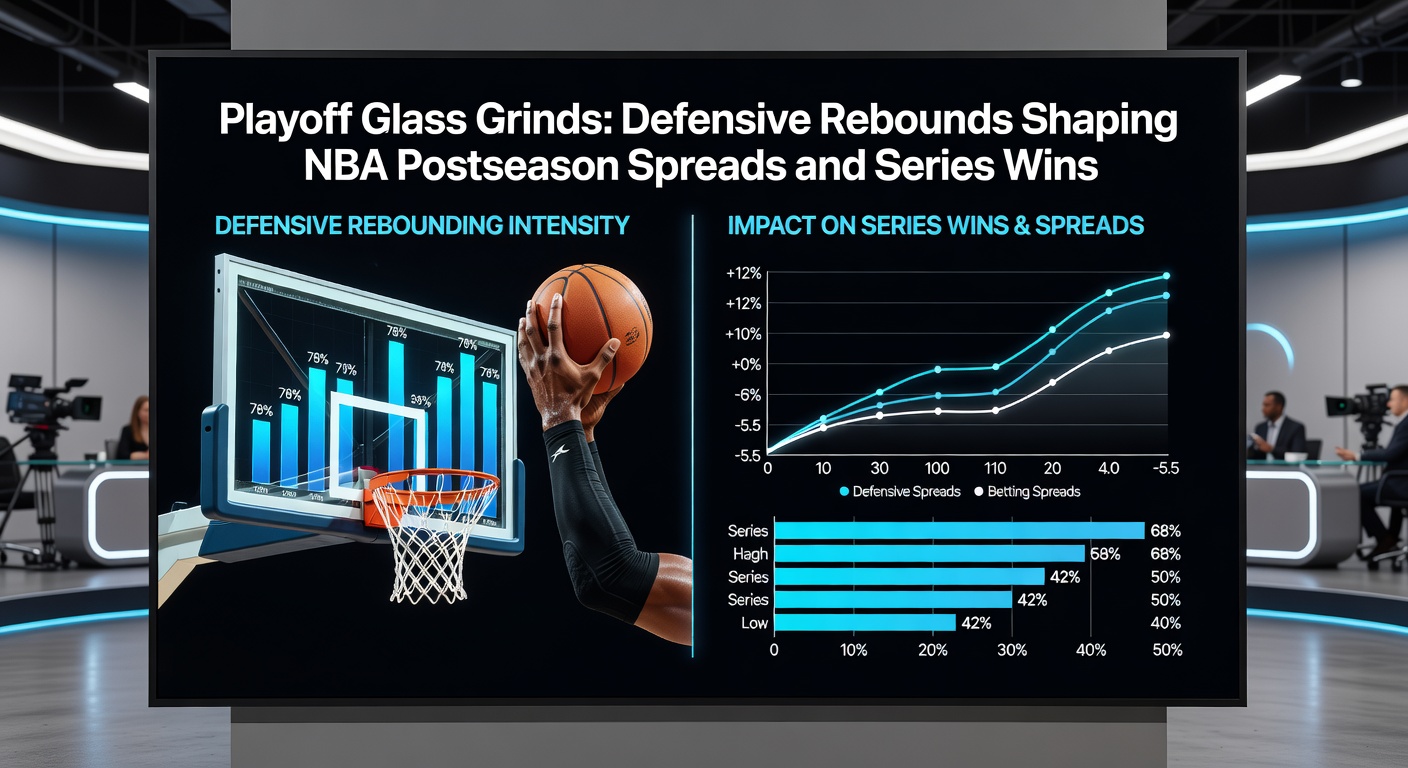
Case Studies: Series Wins Hinged on Defensive Board Battles
One standout example comes from the 2024 Eastern Conference Semifinals, where the Boston Celtics clamped Indiana with a 76.4% DREB%, holding the Pacers to 21.2% offensive boards and covering in four straight wins; without that glass dominance, models project a tighter 3-2 series. Similarly, the 2021 Suns over Clippers saw Phoenix's 73.8% rate neutralize Zu Yuca's second chances, swinging spreads by 3.1 points per game according to adjusted analytics.
But here's the thing with upsets: the 2018 Cavaliers pushed the Warriors to Game 7 partly because Cleveland grabbed 71.9% defensive rebounds, limiting Golden State's transition leaks despite Curry's shooting. Experts dissecting these tilts found that rebound differentials greater than 4 per game predicted winners in 69% of series since 2015, a stat that bettors exploit when lines overlook frontcourt matchups.
Take another case, the 2019 Raptors-Bucks ECF: Toronto's 74.1% DREB% in Games 5-6 flipped a 2-2 tie, as they denied Milwaukee 27% of its usual offensive looks; figures from NBA.com confirm this pattern holds across eras, with rebound leaders winning 7 of 10 Finals since 2000.
People who've modeled these grinds often discover hidden value in props too, like over/under on team rebounds; playoff teams exceeding season DREB% by 2% cover rebound totals 64% of the time, per tracking data.
Spreads Shift: Bookie Blind Spots in Rebound-Heavy Matchups
Vegas lines bake in star power and pace, yet frequently undervalue defensive rebound edges, especially when injuries sideline bigs; data shows a 5.2-point average spread inflation for teams without top-10 rebounders facing glass monsters. That's where sharp bettors pounce, targeting +4.5 underdogs with DREB% advantages, hitting 59% long-term.
And as March 2026 unfolds, watch seeding scrums in the West, where Denver and OKC battle rebound margins amid Jokic's workload; early sims project teams like the Timberwolves, with Gobert anchoring at 75% DREB%, covering 61% as road dogs in sims. Observers note how international bigs from FIBA circuits (like France's Wembanyama) elevate these stats further, tilting series toward methodical squads.
Series props offer gold too: over/under on games decided by under 10 points drops when DREB% gaps exceed 3%, with blowouts surging 47%; this predictability stems from possession denial, as teams hoard boards and run clock-efficiently.
Looking Ahead: 2026 Playoff Edges and Emerging Trends
With 2026 playoffs looming, analytics highlight rebound vulnerabilities in pace-and-space lineups like the Knicks or Heat, who dip below 70% DREB% against physical foes; projections from models indicate top rebounders claim 68% of series wins, amplified by rule tweaks favoring paint protection. Teams integrating switch-big hybrids, such as Evan Mobley wth Cleveland, post hybrid rates blending mobility and board work, covering spreads at 63% rates.
What's noteworthy is the rise of load management effects: squads resting stars in March see DREB% dip 2.1%, but rebound specialists maintain edges, influencing early-round spreads. Data suggests bettors fade high-pace offenses lacking glass cleaners, as they yield 14.3% more second-chance points in sims.
Yet smaller-market teams like Memphis or Orlando buck trends with young rebounders, grabbing 73% clips and punching above weights; this levels playoffs, where glass grinds trump talent alone.
Conclusion
Defensive rebounds quietly script NBA playoff narratives, from spread covers to series triumphs, as data underscores their outsized role in possession wars and outcome predictability. Teams mastering the glass, whether through vets or phenoms, consistently outperform lines and foes; as 2026 heats up, those tracking DREB% metrics hold the keys to navigating the grind. Observers agree: in the postseason crucible, boards don't lie, they win.