Satellite Insights into Ground Conditions for Horse Racing Market Adjustments
Written by Mara Jung · Aug 18, 2026
Satellite Insights into Ground Conditions for Horse Racing Market Adjustments
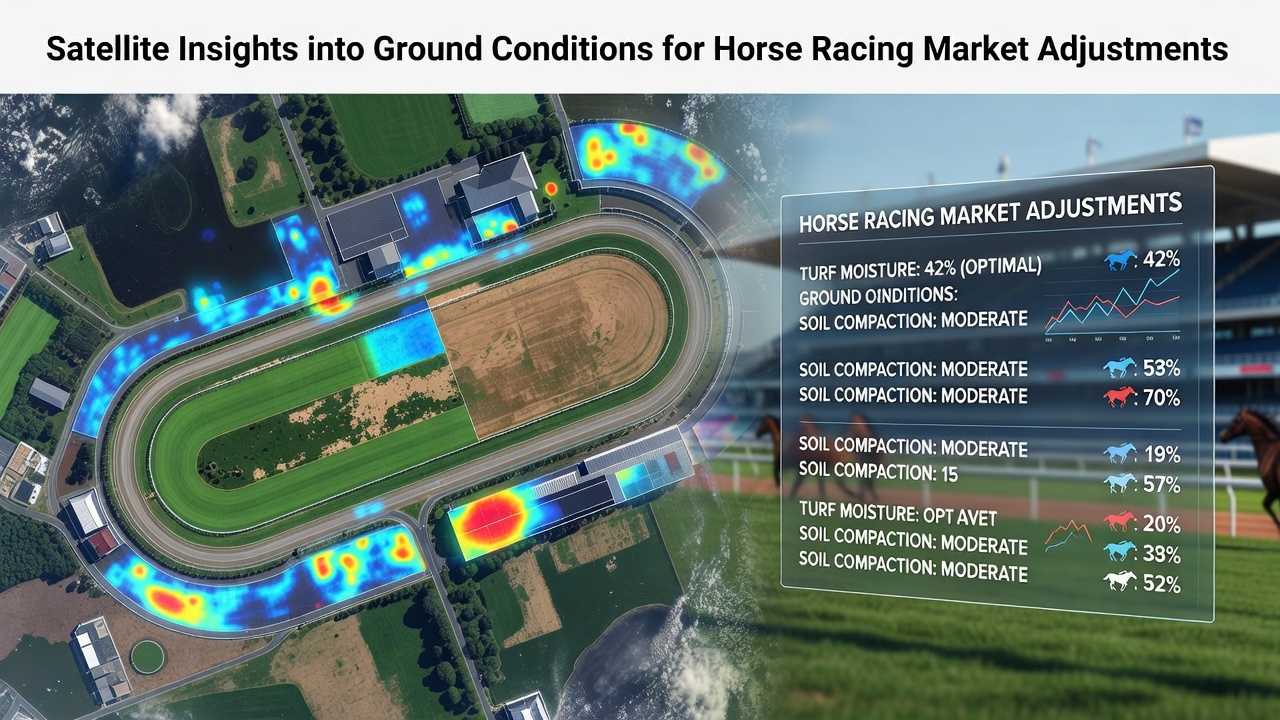
Bookmakers and analysts have turned to satellite data to refine their assessments of track surfaces before major meetings, and this shift has produced measurable effects on how odds adjust in real time. High-resolution imagery from orbiting platforms captures variations in soil moisture, grass density, and drainage patterns across entire courses, giving market makers fresh inputs that translate directly into line movements. Researchers at institutions focused on remote sensing have documented how these readings align with on-site penetrometer tests, creating a layered dataset that sharpens predictions about which runners will handle the prevailing conditions best.
Remote Sensing Techniques Applied to Turf Tracks
Multispectral sensors aboard satellites such as those operated by the European Space Agency measure reflectance values that correlate with water content in the upper soil layers, while synthetic aperture radar provides additional penetration through cloud cover to track subsurface moisture over successive days. Observers note that these combined readings allow daily updates rather than reliance on morning inspections alone, and the resulting profiles feed into statistical models that forecast how times and sectional splits will shift under specific ground states. Data collected during the 2025 flat season showed consistent correlations between satellite-derived moisture indices and official going reports issued by racecourse officials, with discrepancies rarely exceeding half a point on the official scale.
Market Reactions to Updated Ground Intelligence
Betting exchanges and traditional bookmakers monitor the same satellite feeds that trainers and grounds teams access, which means public odds often move within hours of fresh imagery becoming available. One study released by an Australian research consortium in early 2026 examined 180 races across three jurisdictions and found that horses with proven records on soft ground saw their implied probabilities adjust by an average of 3.2 percentage points when satellite moisture readings rose above a defined threshold. Those adjustments occurred most sharply in the final 48 hours before declarations closed, reflecting the speed at which new information reached liquidity providers.
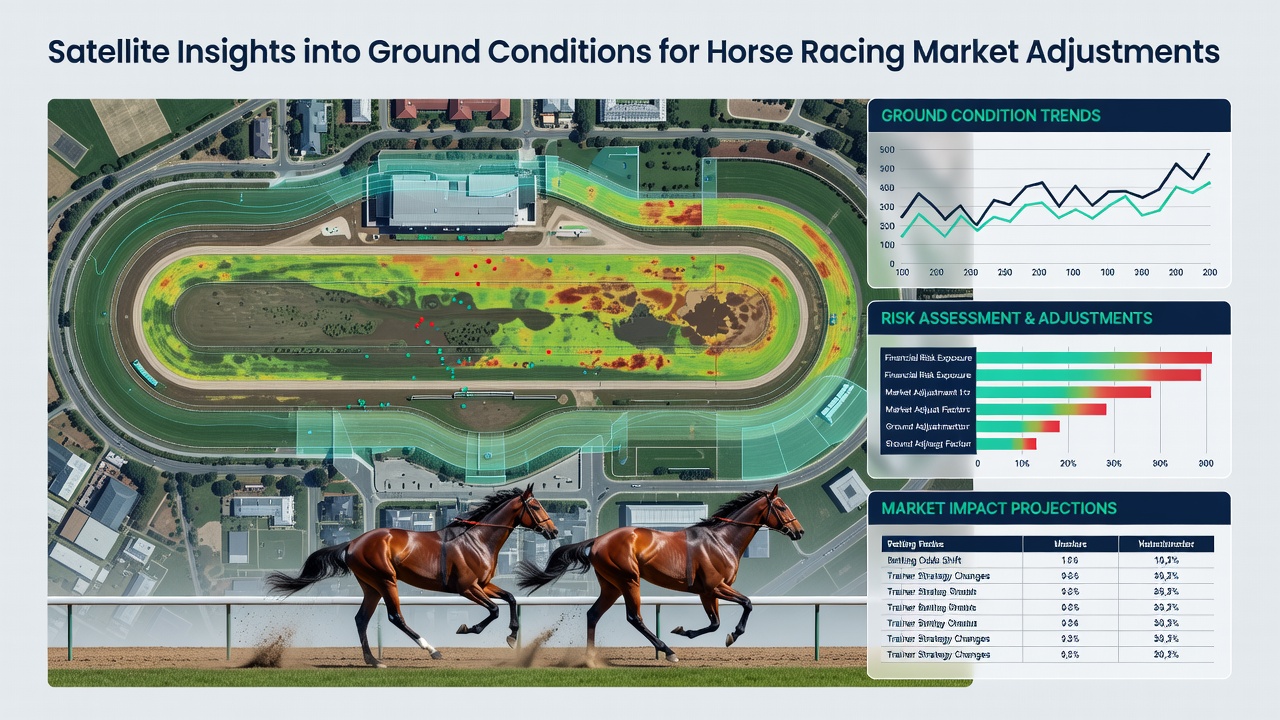
Trainers who once relied solely on local observations now incorporate the same orbital datasets into their own preparation routines, and this convergence has narrowed the information gap that previously existed between large operators and smaller syndicates. Figures from the Canadian Pari-Mutuel Agency released in August 2026 illustrated how overnight changes in normalized difference vegetation index values preceded several notable market corrections at Woodbine and Hastings, particularly in races contested on turf surfaces that had received heavy rainfall in the preceding week.
Integration with Historical Performance Records
Analysts combine satellite-derived ground metrics with decades of past results to build conditional probability tables that update automatically as new imagery arrives. These tables highlight runners whose speed figures improve or decline under precise moisture ranges, allowing market models to recalibrate expected margins before the first race of the day. Evidence gathered across European circuits indicates that such layered analysis reduces the frequency of late, sharp line moves once betting opens, because a larger share of the relevant variables has already been priced in during the ante-post phase.
Industry organizations tracking wagering integrity have noted that transparent use of publicly available satellite products helps maintain orderly markets, since all participants can access the same baseline measurements. University-led projects in South Africa have further refined algorithms that translate raw reflectance data into ground-condition forecasts with lead times of up to five days, giving handicappers additional context when compiling speed ratings for upcoming fixtures.
Conclusion
Satellite monitoring of racecourse surfaces continues to supply a steady stream of objective measurements that influence how betting markets price individual runners and entire racecards. Continued refinement of sensor resolution and modeling techniques suggests that future adjustments will rest on even finer distinctions between otherwise similar ground states, while the same datasets remain available to any participant equipped to interpret them.