Volleyball Rally Scoring Edges: Set Win Probabilities from Serve Receive Efficiency
Written by Mara Jung · Jul 17, 2026
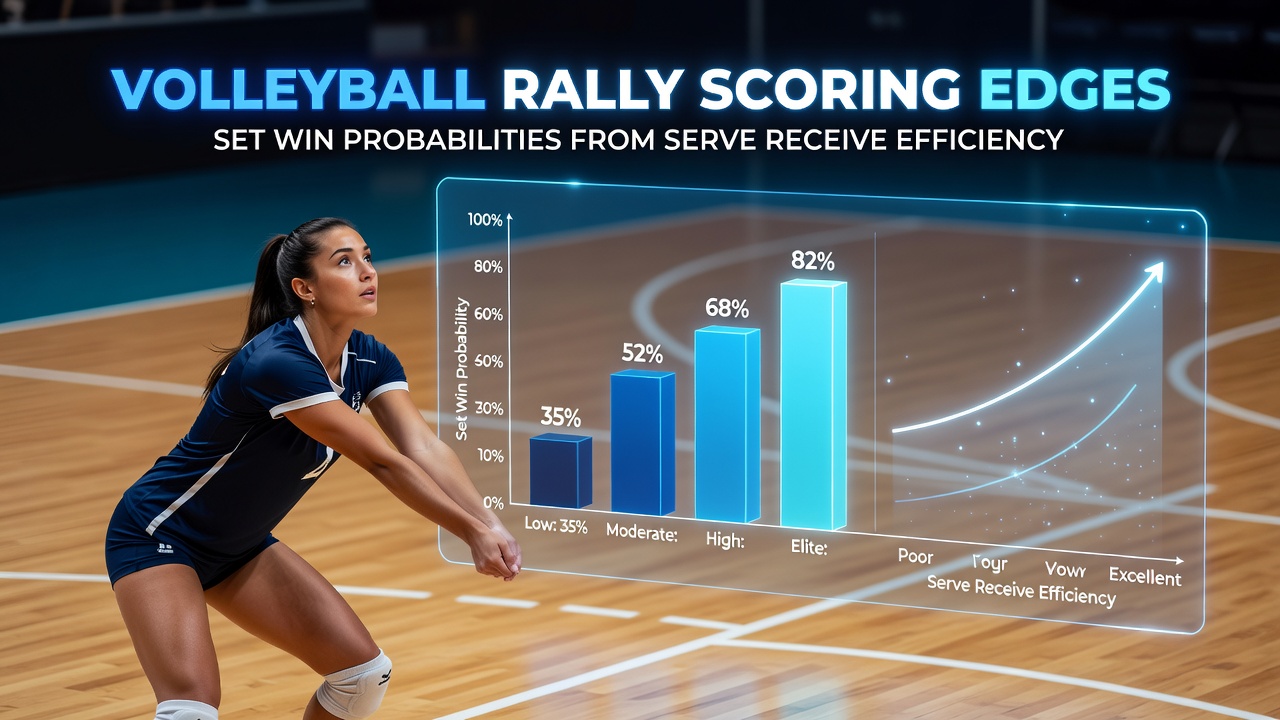
Volleyball Rally Scoring Edges: Set Win Probabilities from Serve Receive Efficiency
Volleyball shifted to rally point scoring decades ago, and that change placed serve receive efficiency at the center of set outcome calculations across professional and collegiate levels. Data from multiple seasons shows that teams achieving serve receive perfection rates above 65 percent convert those possessions into set victories at rates exceeding 75 percent in best-of-five formats, according to aggregated match logs maintained by international governing bodies.
Researchers track serve receive through a standardized scale that rates each contact from zero to three, where a three represents an in-system pass allowing full offensive options. Studies compiled by the European Volleyball Confederation indicate that a one-percentage-point improvement in this efficiency metric correlates wth roughly a 1.8 percent lift in set win probability when all other variables remain constant. Observers note this relationship holds steady across men's and women's competitions, though the magnitude varies by opponent strength and match context.
Measuring Serve Receive in Rally Point Systems
Rally scoring awards a point on every play regardless of which team serves, so the value of a clean receive compounds quickly within each set. Analysts calculate efficiency by dividing the number of perfect or near-perfect passes by total reception attempts, then adjust for error types such as overpasses or shanked balls that directly yield opponent points. Figures from the 2025 FIVB Volleyball Nations League season reveal that squads posting receive efficiencies between 55 and 60 percent still secured set wins in 48 percent of opportunities, yet those numbers dropped sharply below 50 percent efficiency.
Coaching staffs break down film into zones and serve types, because float serves and jump serves produce different receive distributions. Data collected by the Australian Institute of Sport demonstrates that teams facing predominantly jump-float combinations improved their set conversion rates by 4 to 6 percent after targeted receive drills that emphasized platform angle adjustments. These adjustments matter because each additional rally won on serve receive reduces the number of times a team must defend from a disadvantageous position later in the set.
Statistical Models Linking Receive Efficiency to Set Wins
Logistic regression models built on thousands of sets played between 2020 and 2025 consistently rank serve receive efficiency among the top three predictors of set victory, trailing only kill percentage and opponent error rate. One model published through a Canadian university research initiative assigned a 0.72 coefficient to receive efficiency when predicting set outcomes, meaning the variable exerts substantial influence even after controlling for blocking and attacking metrics. Teams that maintain receive efficiency above 62 percent throughout a five-set match win the deciding set in approximately 68 percent of cases according to those same datasets.
What's interesting is how the probability curves flatten at the extremes. When receive efficiency falls under 45 percent, set win chances rarely exceed 25 percent regardless of serving strength, because the opposing team gains repeated free swings at the net. Conversely, efficiencies above 70 percent produce diminishing returns once a squad already controls most rallies, though such elite performance still separates medal contenders at major tournaments. Analysts update these models after each major event, incorporating new serve tactics observed during the 2026 qualification cycle that began in July.
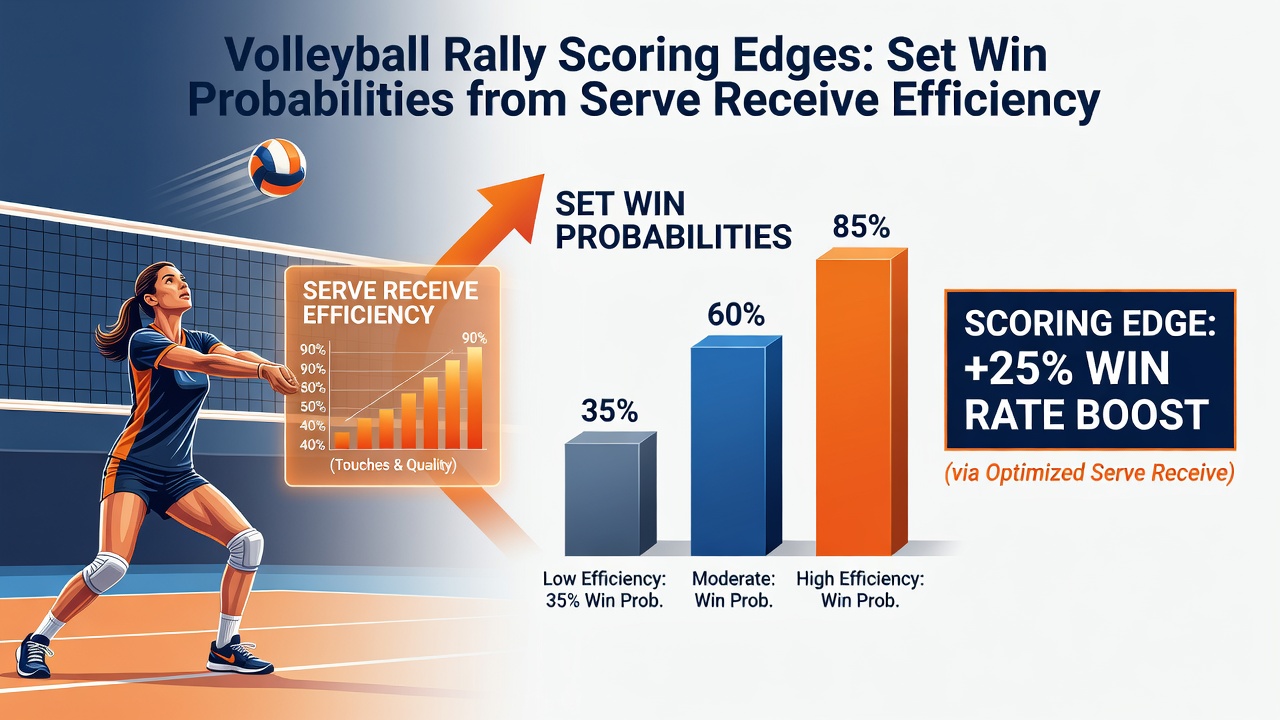
League-Specific Patterns and Recent Trends
Domestic leagues display slightly different baselines than international play because roster depth and travel schedules affect consistency. In the Italian Serie A, for example, mid-table teams that improved receive efficiency by five points over a season increased their set win totals by an average of 11 additional sets. Similar patterns appear in Brazil's Superliga, where data from the past three campaigns shows receive efficiency explaining nearly 40 percent of the variance in final set scores during regular-season matches.
Gender differences surface in the data as well. Women's collegiate matches in North America tend to feature higher overall receive efficiencies than men's matches at the same level, partly because serve velocities differ and partly because defensive systems emphasize different footwork patterns. Yet the slope of the probability curve remains comparable, so a five-point efficiency gap still translates into similar set-win advantages for both genders once adjusted for average rally length.
Practical Applications for Teams and Analysts
Performance analysts feed receive data into real-time dashboards that flag when a team's efficiency drops during a match, prompting substitutions or system changes before the deficit becomes insurmountable. One approach involves tracking individual passer grades against specific server profiles, then rotating lineups to exploit mismatches. These granular adjustments have produced measurable lifts in set conversion rates during the latter stages of tournaments where fatigue amplifies small efficiency differences.
Video review sessions now routinely include probability heat maps that illustrate how each receive grade alters projected set outcomes. Such tools help players understand why a slightly slower platform angle can shift a 50-50 set into a 60-40 advantage before the ball even reaches the setter. Training programs incorporate these visualizations to reinforce decision-making under pressure rather than relying solely on repetition of technique.
Conclusion
Serve receive efficiency functions as a foundational driver of set win probabilities under rally scoring rules, and quantitative models confirm its consistent influence across competitions and time periods. Continued collection of high-resolution data through July 2026 and beyond will refine these relationships further, allowing teams to allocate practice time and in-match adjustments with greater precision based on verified statistical links rather than intuition alone.